Table of Contents
Selecting a project from the dashboard brings you to Squish Test Center's project details page, which has tabs for Explore, History and possibly other buttons for optional add-ons. The Explore view contains a detailed overview of your projects' tests, organized by Batch, and filtered by the Label you've set during your upload. There are a number of ways to view your result uploads, by adjusting the Explore view. We will review each key feature of this page below.
At the top of the Explore View you can find the breadcrumbs bar which shows you the granularity of the view and which Tests you are currently looking at. The first element of the breadcrumbs bar will always show you the currently selected Batch and will give you the option to switch back and forth between different batches.
 |
The last element shows the granularity of the view, i.e it shows at which level of the Test-structure you are currently looking at. Furthermore it lets you switch to a specific granularity via a drop-down menu. The drop-down menu can contain the following choices:
Test Suite --> Test Case --> Feature --> Scenario --> Step --> Section
Depending whether test is a BDD test case or not and/or having defined test sections, not all choices will be available.
The table represents the bulk of the Squish Test Center tab. By using the tick boxes in the left vertical pane, you are able to control which data is shown in the table according to Label.
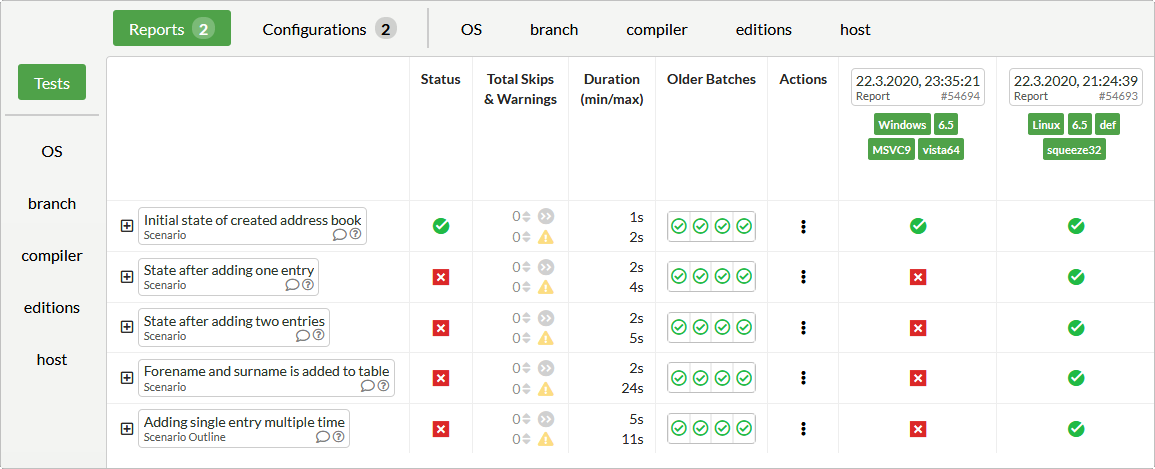
In the default view of the table, with Reports and Tests highlighted, you see an overview of your test suite and its history:
The first column gives the name of the Test elements.
The second column displays passed (
 ) or failed (
 ) for the Status
of a test across all uploaded
Reports of a Batch.
Clicking on one of these indicators brings you to the Verifications View (Section 3.4).
) for the Status
of a test across all uploaded
Reports of a Batch.
Clicking on one of these indicators brings you to the Verifications View (Section 3.4).
The Total Skips & Warnings column shows an aggregation of all skips and warnings as well as an indicator that shows if the number of skips and warnings have changed since the last execution.
The Duration column gives the minimum and maximum time needed for the execution of a Test across the Reports of a Batch.
The Older Batches column gives a quick graphical view of the last four Batches, i.e. it shows whether a Test has passed (
) or failed () in the recent past.
The Actions column gives you access to additional functionality via a dropdown menu. If you have activated the Jira or Zephyr integration, this will allow you to create issues or test items on the 3rd party system.
 |
The table can be used in a one-dimensional manner, by choosing Reports on the top bar and a single label on the vertical axis, like OS. This will display a list of operating systems (or whatever other label is chosen) and its checks and duration. To use the table in a two-dimensional manner, select a different Label on each of the axes. This will group the Labels according to your configuration.
Table of Contents
When Entire Batch is selected in the left hand Report selection pane, the Pivot Table will show all tests across all reports which have been uploaded to the currently selected Batch and that match the selected hierarchy in the breadcrumbs bar above the pivot and Batch summary.
 |
At the top of the Batch View you will find the Batch Summary. Besides the Start Time, End Time, Total Duration and Run Duration the Batch Summary includes three pie charts that summarize:
The number of passed and failed Reports
The number of passed and failed Tests (summarized across all iterations and configurations)
The number of passed and failed Test Runs (individually counting each iteration or configuration)
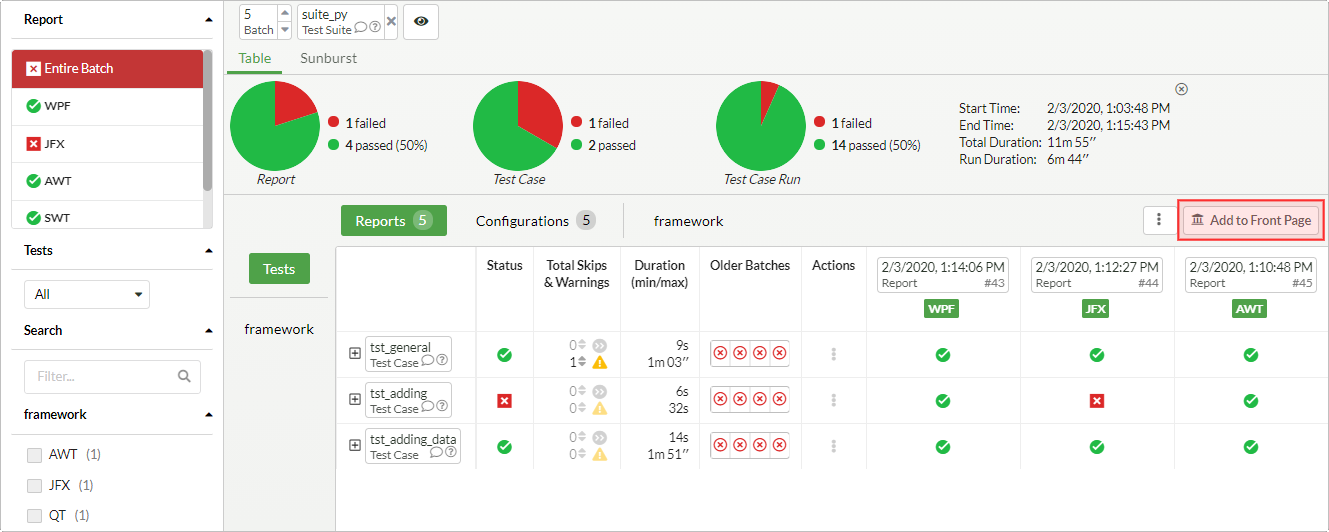
Above the Test Results Pivot on the right-hand side admin users will find a dropdown menu with additional options:
Delete Batch: To permanently delete an entire Batch including all results and attachments
Rename Batch: To rename a Batch
Next to the admin menu the button can be found. Use this button to add a summary of the currently configured result view to the Dashboard (Section 3.1).
Multiple different types of summaries are available:
Test Items Table
Shows a result summary for the Test Items shown in the Explore View.
Pie Charts Diagram
This adds the entire summary section of the Explore View to the Dashboard. The summary section contains 3 Pie Charts that show the number of passed Reports, Tests and Test Runs.
Result Summary Text
Shows the overall test result as well as a textual summary of the number of passed and failed Reports and Tests.
The list of Reports from the current batch is located above the view modes and label filters. By default, Entire Batch is selected, and all reports are shown. For each report item in the list, its summarized test status as well as its labels are displayed. Selecting a report from this list brings up the single report view and adds this selection to the breadcrumbs.
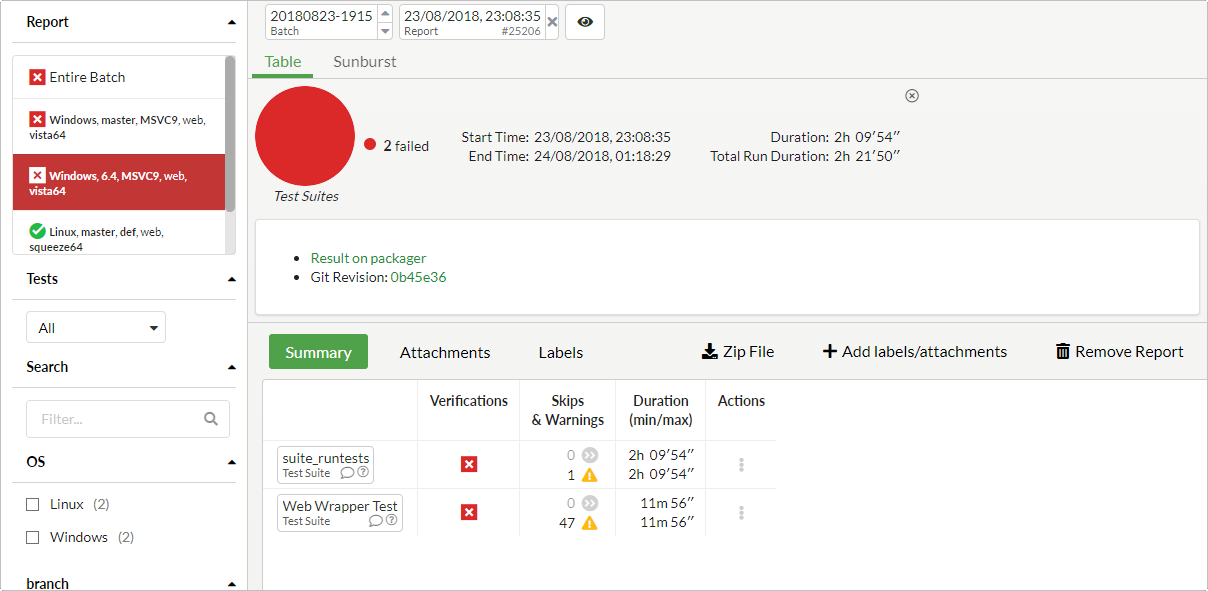 |
The Single Report View Mode displays the following elements:
A report summary, similar to the one used when viewing the entire batch.
If the report contains a README.md file in the markdown format, then its contents are displayed below the report summary. This is a good way of connecting your results to custom metadata. Examples include hyperlinks to build artifacts and the version control system revision of your AUT used for this test execution.
The Summary table shows your test results, from which you can also navigate to the Verifications page.
Selecting Attachments lists all attached files of this report and allows you to view their content. Additionally, administrators can remove attachments.
Selecting Labels lists all labels that have been added to this report. Additionally, administrators can remove labels.
Clicking downloads a zipped folder containing the test results and attachments of this report.
An administrator clicking on enters a dialog where they can upload attachments and add labels to the report.
An administrator clicking on can choose to permanently delete the report, including all of its results and attachments. Deleting the last report of a batch will delete the batch as well.
![[Note]](images/note.png) | Note |
|---|---|
UI elements for actions that require administrator access (such as editing or removing the report) are only shown when logged in as an administrator. |
Right underneath the breadcrumbs bar you can find a tabbar that lets you switch between the table view, which has been described in the previous section, and the sunburst view. The sunburst view is an alternative representation of the same data.
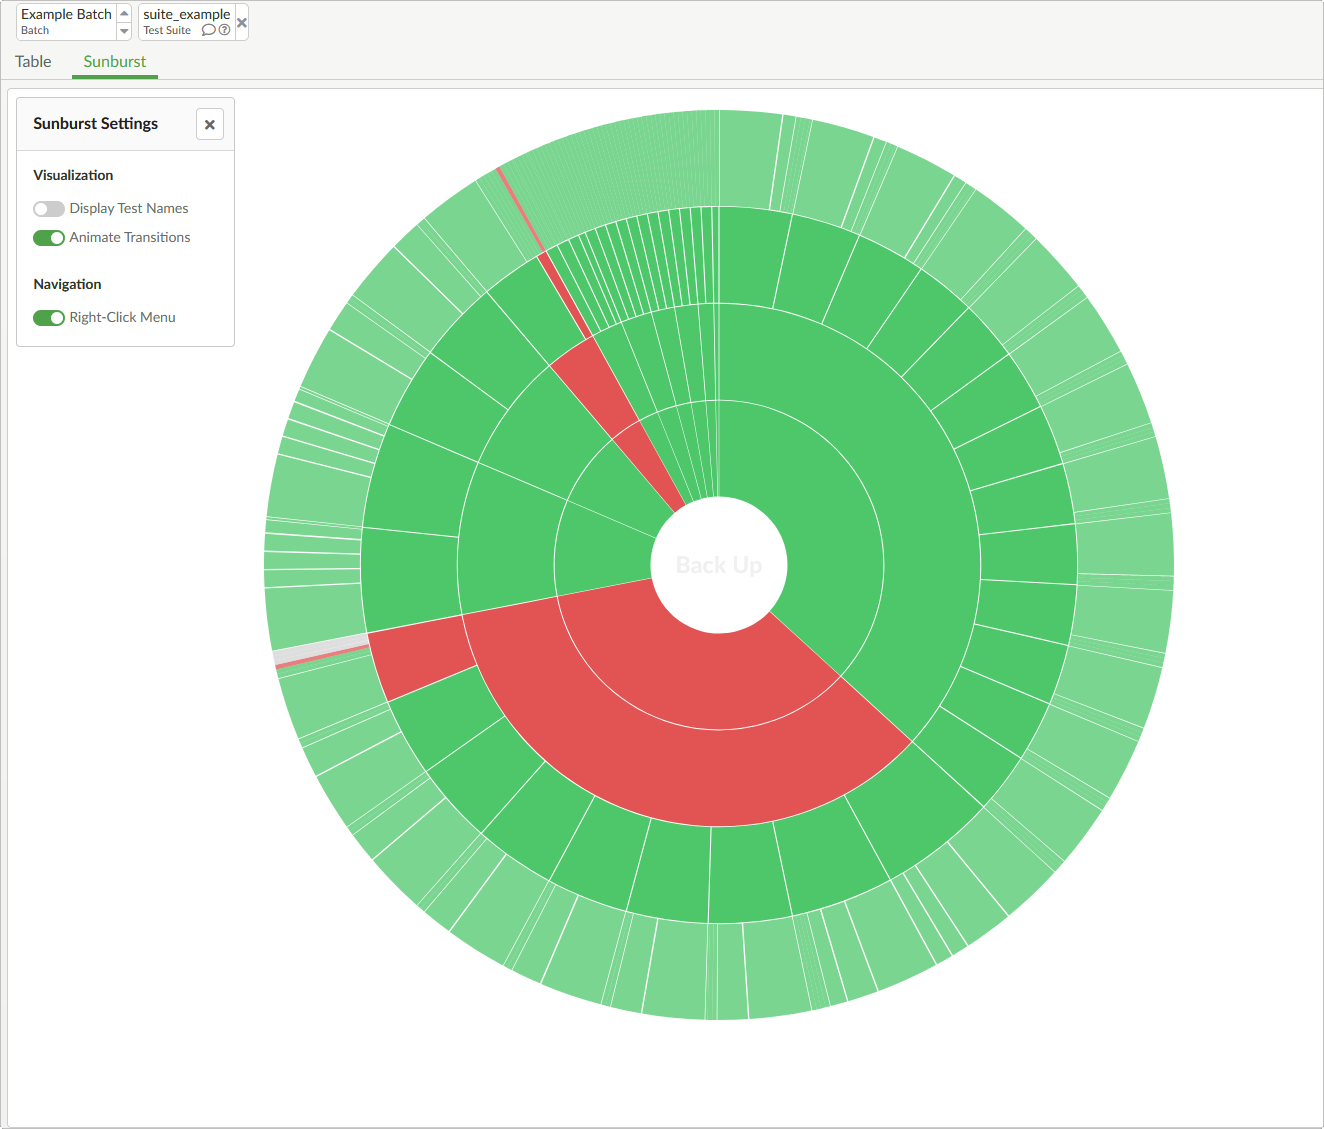 |
Each slice of the sunburst diagram represents a test item. The slices are colored green if the test item passed, red if it failed and gray if the test item was skipped. The size of the slices is determined by the number of verifications associated with the item.
Hovering the sunburst diagram slices with the mouse will display a tooltip that contains the name as well as the type of the test item hovered. Clicking on a slice will set the origin of the sunburst diagram to the test item clicked on (drill down). Clicking on the center of the sunburst diagram will set the origin to the parent of the currently selected test item (drill up).
In the top left corner next to the diagram you can find a settings menu with the following options:
Display Test Names can be used to disable rendering of test item names on the diagram slices. Since the space within the sunburst slices is very limited the text has to be truncated by default. Since the test names are also visible in the tooltips you can disable the rendering to achieve a cleaner look.
Animate Transitions can be used to disable transition animations when drilling down or up. When you have a lot of test items the animations might become very computationally expensive, so this option can be used to reduce the strain put on your browser.
Right clicking on a diagram slice will open a custom Right-Click Menu, which allows you to easily jump to the Verifications View (Section 3.4), the History View (Section 3.3) or the table view. If you prefer the default browser right click menu, you can disable the custom menu. When disabled the same menu will open on left clicks instead.
The pivot table in the explore view will display coverage values (in %) from Squish Coco coverage reports next to the test status. Clicking on the coverage value will select that report and switch to the Code Coverage view. You can also reach that view by selecting the tab beneath the breadcrumbs.
The coverage method can be selected from the filter pane on the left (under the Coverage section), allowing you to choose between function-, line-, statement(block)-, decision-, condition-, MC/DC-, and MCC-coverage.
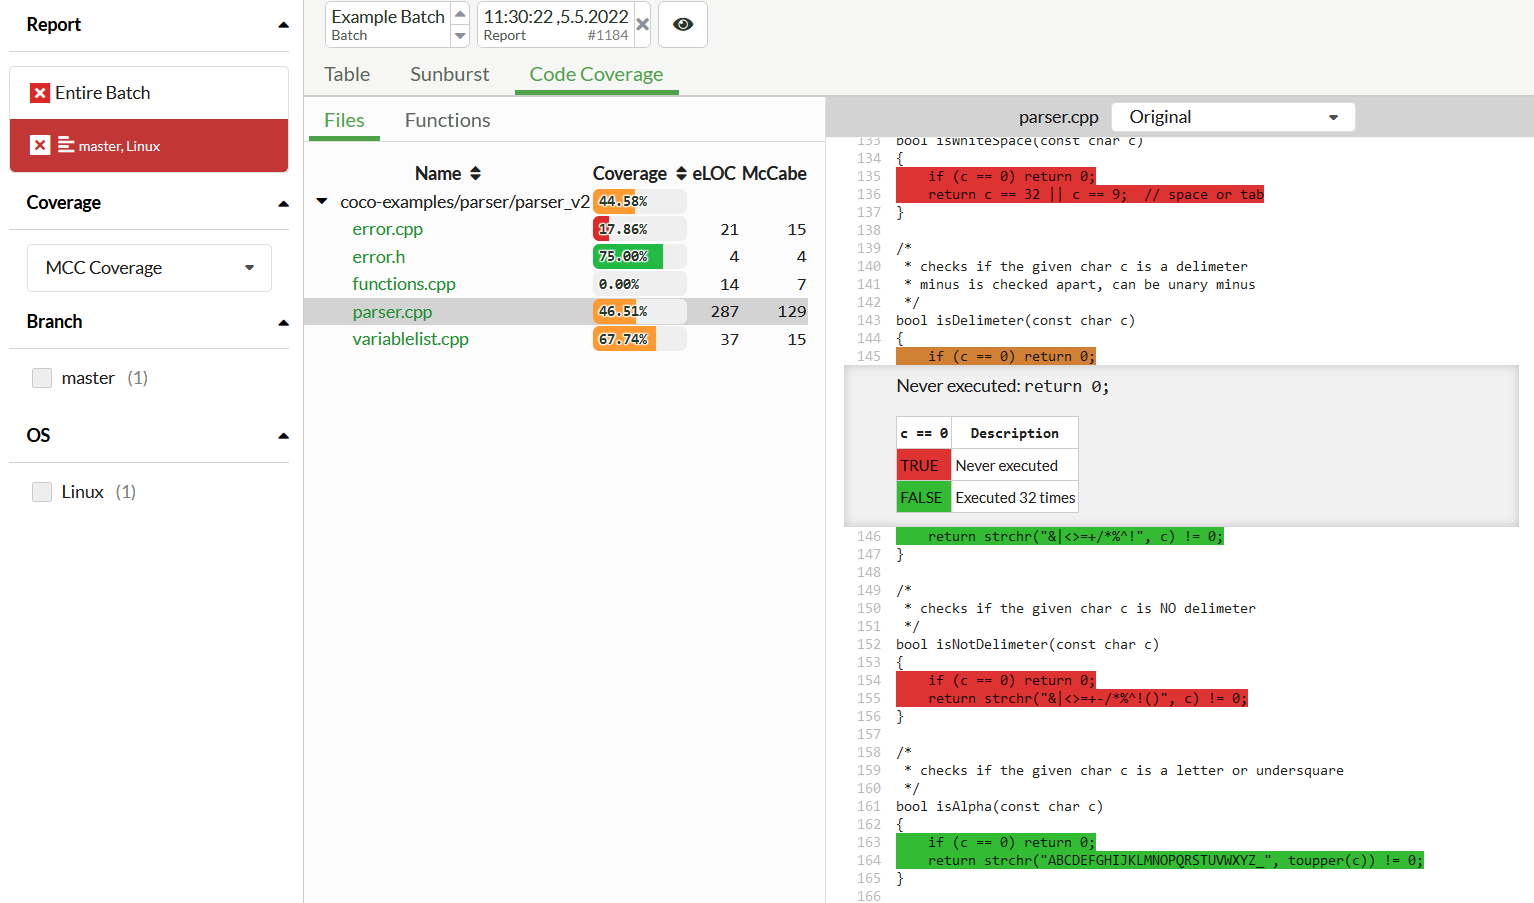 |
Inside of the Code Coverage tab, a source file hierarchy is shown on the left, together with the coverage, eLOC, and McCabe complexity of each file. You can switch to showing a class- and function-hierarchy using the and tabs above the hierarchy. Selecting a file or function will open its highlighted source code on the right (or below on narrow screens). Clicking on any of the highlighted lines in the source code will toggle an inline tooltip containing further explanation, user comments, or truth tables for decisions or conditions.
The color palette used for highlighting matches the one used by Squish Coco's coverage browser and reports. Choose the coverage method in the left-hand filter pane to see the relevant coverage highlighted. You can also switch between viewing the and source code, using the source type dropdown in the header above the source code view.
The list of tests displayed in the tests table not only depends on the breadcrumb and granularity selection, but also on which Labels and view modes are selected. E.g. a test suite may have different test cases depending which Labels are selected. Also the list of test cases may change over time when you add or remove tests.
The Tests filter selection dropdown, which you can find on the left side above the Search filter selection, offers the following options:
All shows all tests that have been executed in the currently selected Batch.
With Failures shows only tests that contain failures in the currently selected Batch.
With new Failures shows only tests that contain failures in the currently selected Batch, but had succeeded in the previous Batch.
Not Executed shows all tests that have not been executed in the Reports determined by the current Batch and Label selection.