Signing into Squish Test Center brings you to the dashboard of the program, which is a customizable overview of your server.
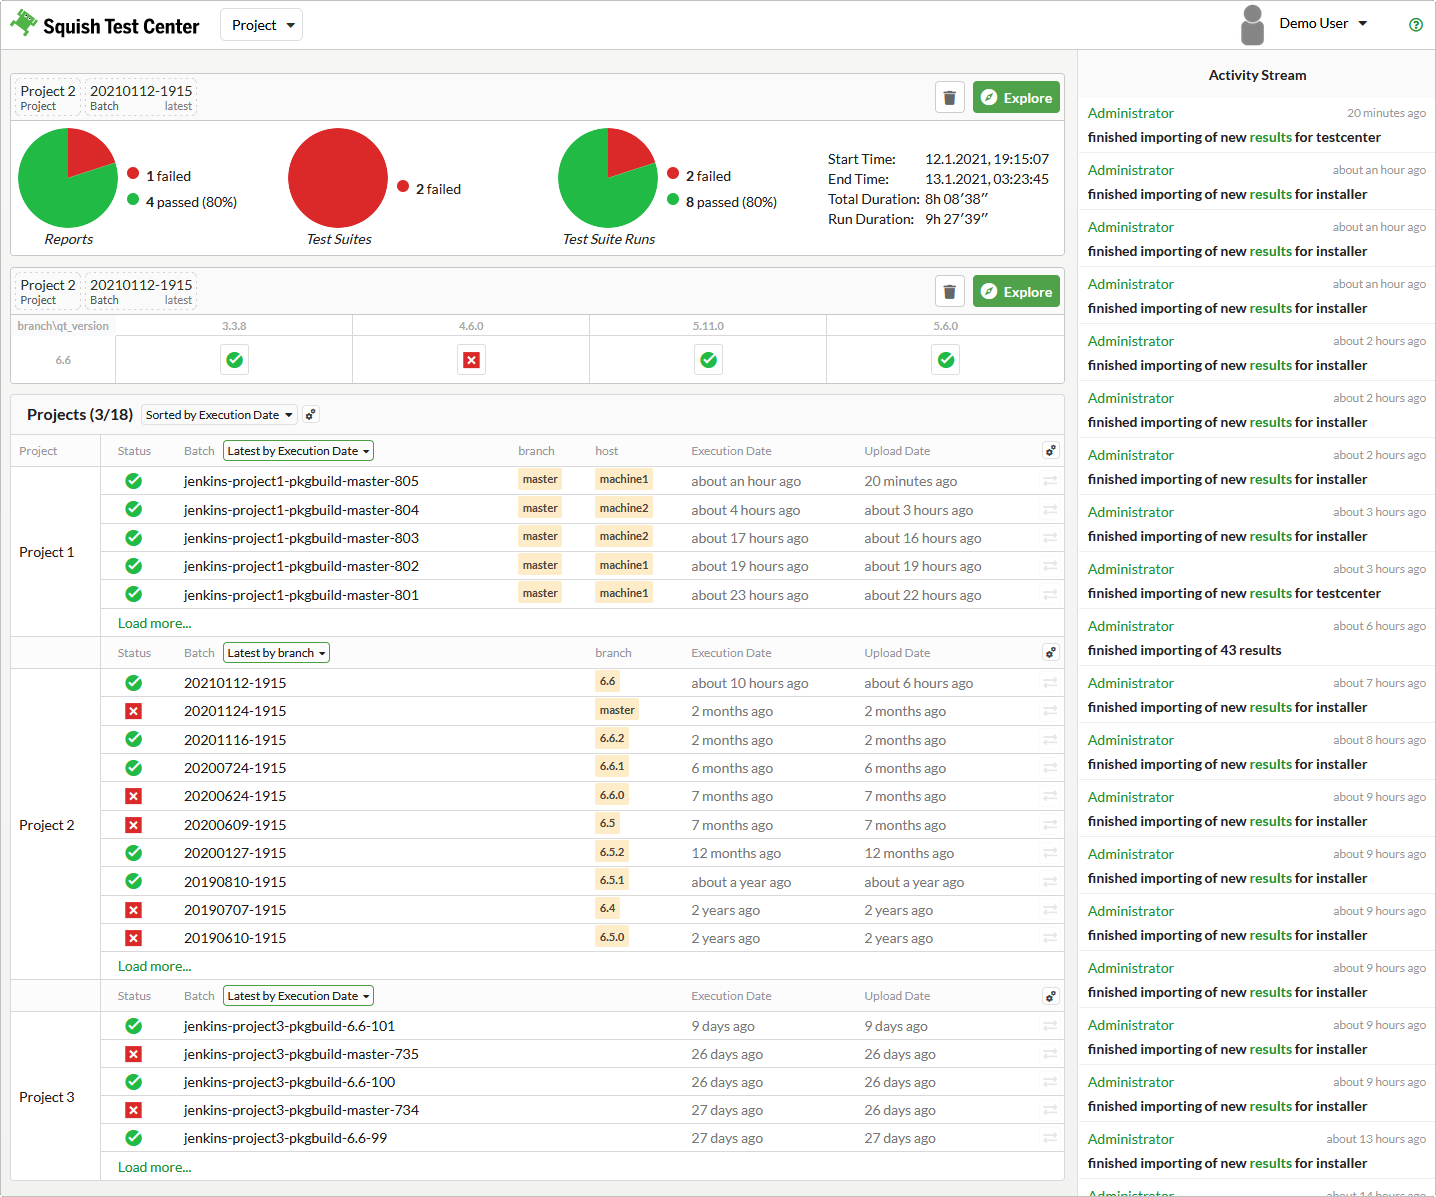 |
To the right is the Activity Stream, a compressed view of recent activity, including result uploads and new user additions.
In the top left area is the bookmark section. This might be empty when you first start to use Squish Test Center. The bookmark section can give you easy access to specific views that are important to you. You can use the Add to Front Page button on the Batch View (Section 3.2.2.1) page,to add a small summary of the currently configured view to the bookmark section of the dashboard. Different summary types are available:
Test Items Table
Shows a result summary for the Test Items shown in the Explore View.
Pie Charts Diagram
This adds the entire summary section of the Explore View to the Dashboard. The summary section contains 3 Pie Charts that show the number of passed Reports, Tests and Test Runs.
Result Summary Text
Shows the overall test result as well as a textual summary of the number of passed and failed Reports and Tests.
On the lower left side of the dashboard is your Project Overview, which you can use to get a summarized overview of the most recent results in all of your projects.
At the top of the Project Overview you can find configuration options to either sort your projects by Execution Date, which will see the Project with the most recent test execution at the top, or by Upload Date, which will see the Project with the most recent result upload at the top, or by Alphabet which will keep your projects in a stable alphabetical order. Furthermore you can use the Gear-Icon to Filter out projects that are not relevant to you.
By default the project overview is configured to show you the latest 5 Batches for each Project. For each Batch you can see whether it has passed or failed, you can see it's name as well as it's Execution Date and Upload Date. You can use the dropdown menu above the Batch columns to chose whether you want the Batches ordered by Execution Date or Upload Date or by any of the labels that you might have assigned during result upload. You can use this third sorting option to get the latest test result for each label value (e.g. if you upload results for multiple branches you can use this option to see the most recent result for each branch).
Above each Project section you will find another Gear-Icon which will open a configuration menu that lets you configure how many results are displayed for each Project and which makes it possible to select additional columns based on the labels you have assigned to your uploaded results.
The Project Overview also offers quick access to the comparison functionality. You can use the compare buttons found in the right most column to select two batches for comparison.