Table of Contents
The goal of the History view is to allow navigating to a specific point in time and to show the results or accumulations of results for a specific range, starting at the specified point in time.
The breadcrumbs bar at the top of the History view as well as the Test-structure navigation work the same as on the Explore View (Section 3.2). It is also possible to filter the selection using Labels, just like in the Explore view.
 |
The History View offers 3 main sections: Timeline, Statistics and Graphs.
Next to the section selection, you can configure the time frame shown for each section. You can chose one of the following preconfigured time frames: Today, Yesterday, Last 24 Hours, This Week, Last Week, Last 7 Days, This Month, Last Month, Last 30 Days, Last 10 Batches or you can select Custom Range and use the date picker controls to pick a start and end date. You can shift any of the selected time frames by using the left and right buttons.
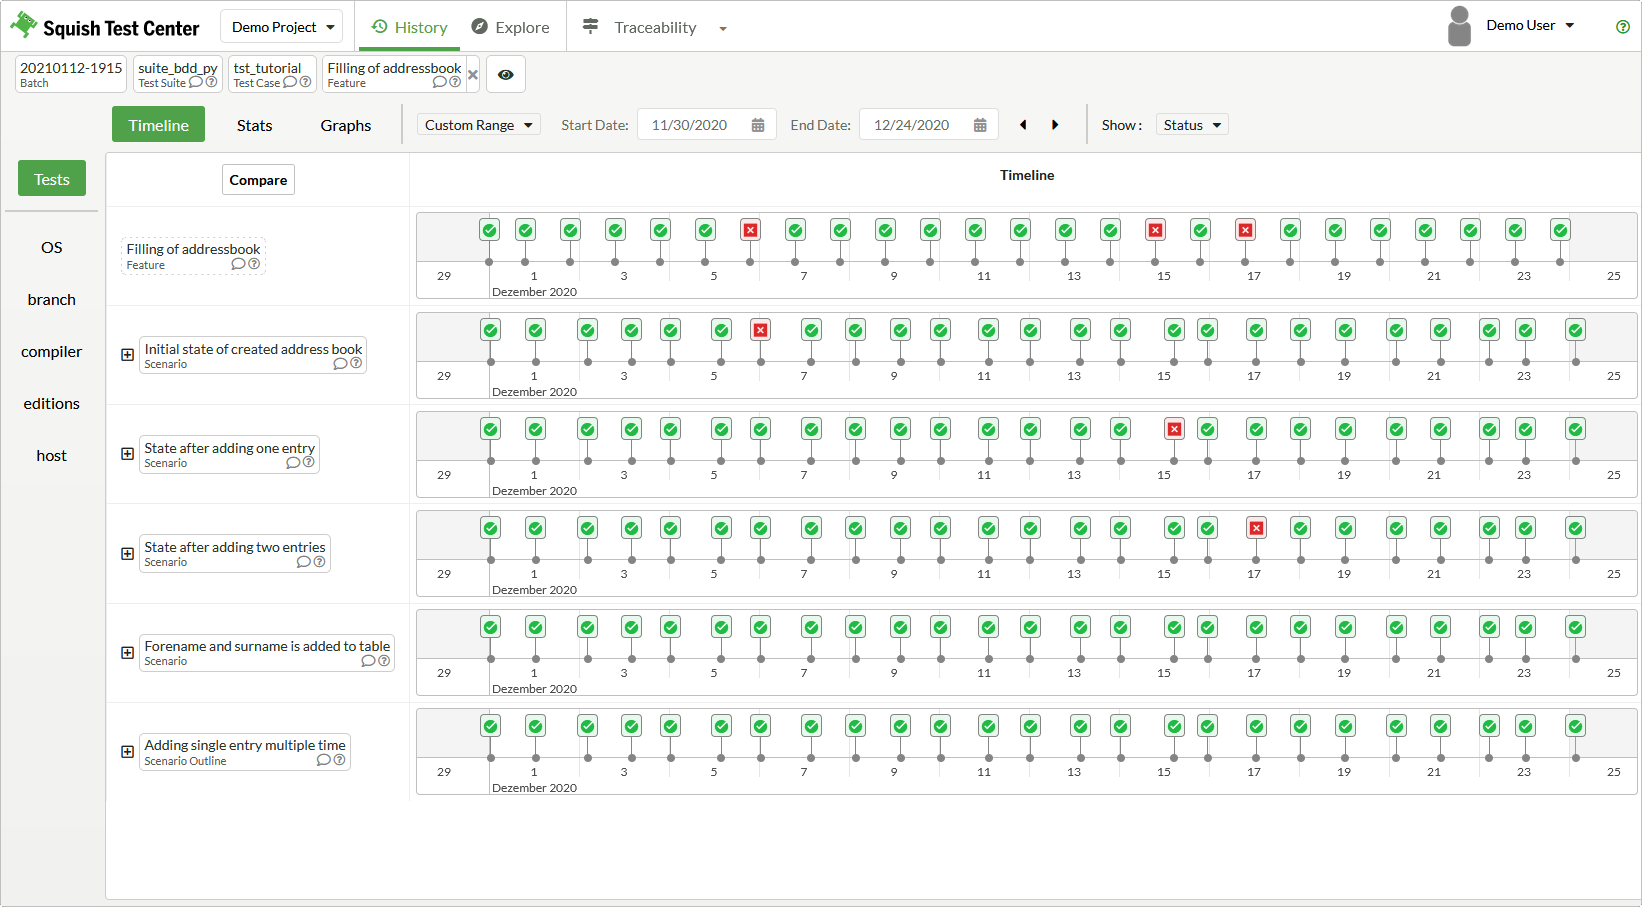
The Timeline section shows all batches of the selected time frame as green boxes when the batch had no failures for the Test or as red boxes when the batch had at least one failure for the specified Test. By clicking on the boxes you can jump to the Explore View (Section 3.2) to further analyze the details of the test execution.
The Stats section gives various statistics on a Test. All metrics ignore retried and skipped Tests.
The metrics are defined as follows:
- Flakiness
Measures test stability in terms of state changes (pass --> fail, fail --> pass) and based on the number of executions. Given N runs and M times the result changes state, in either direction, the flakiness is M/N.
- Success Rate
Given number of passed runs P and total number of runs N, the success rate is P/N.
- Times broken
Indicates the number of times a failure occurred, not necessarily the number of incurred failures.
- Retry Count
Total number of times a Test was retried.
- Skip rate
Given number of skipped runs S and total number of runs N, the skip rate is S/N.
- Average Duration
Lists the suite's runtime, averaged against all test executions within the specified time period.
- Average time to fix after failure
Shows the average time until the Tests recovered to a passing state.
- Average runs between fixes
Shows the average number of runs until the Tests recovered to a passing state.
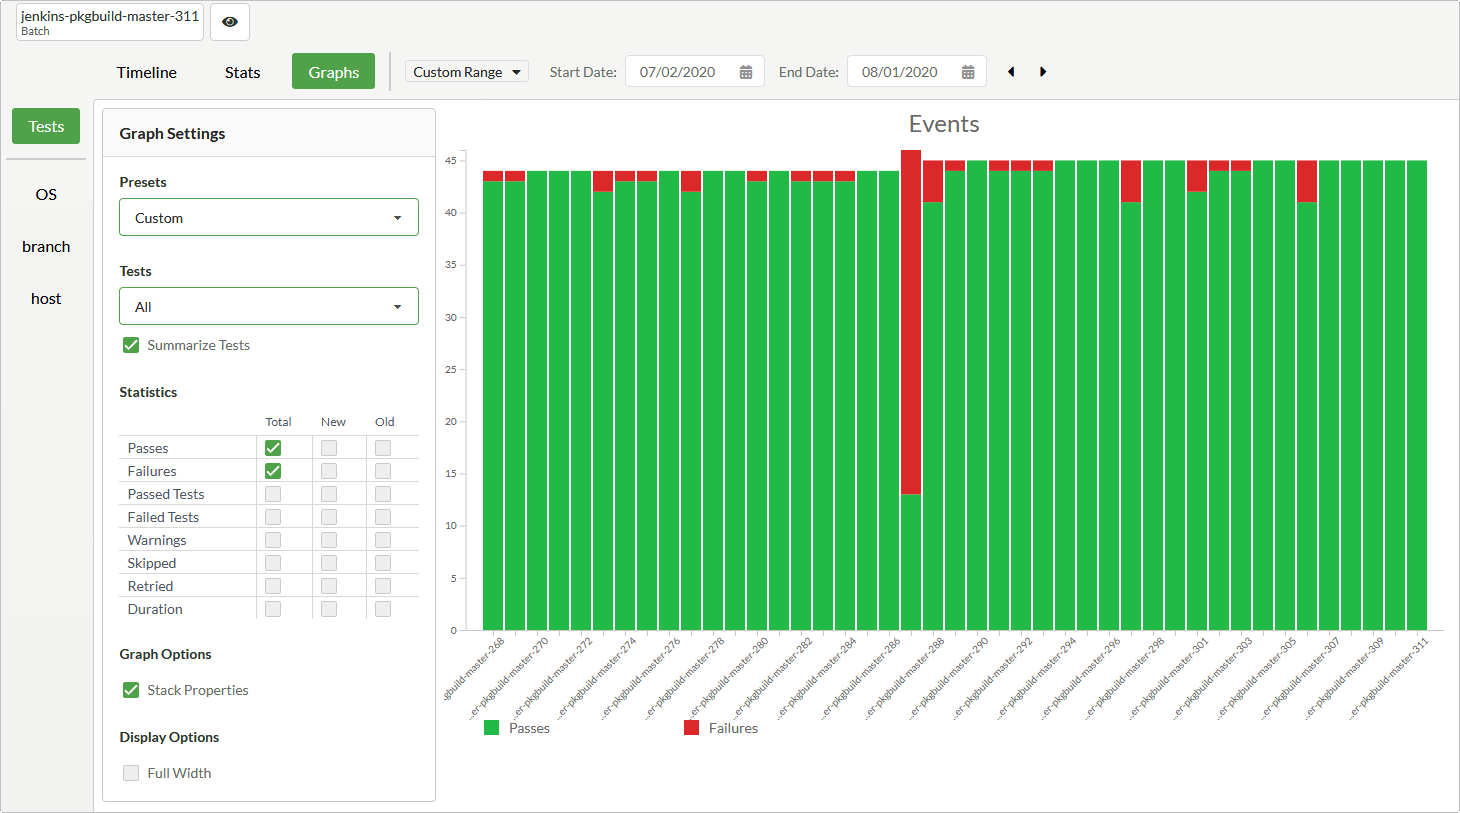
The Graphs section contains graphs for many test properties. You can use the Presets combo box to select a predefined graph like Total Passes and Failures or Test Duration By Tests. You can also configure a custom graph by selecting any of the test properties in the Statistics section. The available test properties include Passes, Failures, Passed Tests, Failed Tests, Warnings, Skips, Retries and Duration.
When Summarize Tests or Summarize Labels is enabled the property values of all currently selected tests or labels get summarized. When this option is disabled each test or label is denoted separately in the graph.
 |
When viewing a , there is a button which when clicked, makes two batch selection dropdowns appear. By clicking on the boxes of a timeline, the batch selected will change. For convenience the active batch selection dropdown alternates after each selection.

The button right of the two dropdowns then enters the compare page. The Cancel button deselects the compare mode.
The Compare page has a test run selection list for both batches that were selected on the History View (Section 3.3) and a side-by-side comparison of two runs. The side-by-side comparison shows child tests or test verifications and logs, depending on the granularity of the History View (Section 3.3) compare selection. On the left, the test run selected in the upper batch and on the right the selected lower batch.
A common child test can be entered, the comparison changes for only that child test. On the other hand, a click on a breadcrumb element will show the comparison of a common parent test.
If you want to see Squish Coco coverage information in the timeline, you can select Coverage from the item content selection above the timeline (labeled "Show:"). Coverage percentages will then show up next to the status symbols representing the batches inside the timeline. For batches containing multiple coverage reports, the coverage values are concatenated.
The coverage method can be selected from the filter pane on the left, allowing you to choose between function-, line-, statement(block)-, decision-, condition-, MC/DC-, and MCC-coverage.
The history graph view allows you to inspect coverage values over time. In the Graph Settings widget, you can select and combine coverage values for each of the above mentioned coverage methods. Note that coverage statistics and test statistics and cannot be selected together.
![[Note]](images/note.png) | Note |
|---|---|
Squish Test Center will only show coverage over time in the history graphs if it can identify a single relevant coverage report for each batch. This means either a single uploaded coverage report per batch or selected set of labels (in the left-hand filter pane) that filters for a single coverage report for each batch. |